
Baseball’s Big Data Revolution
America's Pastime has moved from the dusty fields of old into a sabermetric matrix of big data, futuristic technology and high-stakes analysis.
Baseball in the modern age is really the marriage of two games: the game played on the field, and the big data game played out behind the scenes. The sport has undergone a sea change in recent years as teams, players and fans have gained access to billions of data points that have permanently altered the way teams are built, the way the game is played, and the ways the public consumes the sport. Two elements of big data, in particular, have played especially key roles in the changing landscape of professional baseball: sabermetrics and Statcast.
SABERMETRICS: NOT YOUR FATHER’S STATS
Sabermetrics is the application of advanced statistical analysis to baseball teams, players and outcomes, and the practice has become standard for all 30 major league organizations. Baseball is unique in that large sample sizes (each team plays 162 games in a season, and players often have long careers relative to other sports) of data are available for analysis, and the traditional ways of measuring player performance (stats like Batting Average and On-Base Percentage, which are fairly straightforward, even for casual fans) have been overtaken by stats like Weighted Runs Created (wRC+), Wins Above Replacement (WAR) and Expected Fielding-Independent Pitching (xFIP) [1]. The goal of many of these statistics is to strip out the effects of randomness and “luck” on the performance of individual players, and to determine which metrics, in particular, will best predict future performance. [2]

STATCAST: DAMN, THAT’S FUTURISTIC

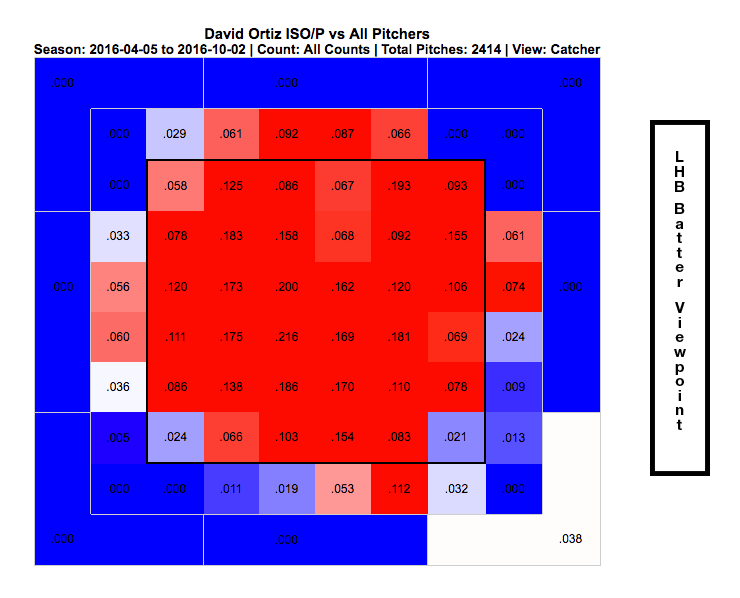
Statcast is a natural extension of Major League Baseball’s newfound obsession with data and sabermetrics. MLB purchased a technology called Trackman (which is based on Doppler radar, and was originally used to track golf swings), and installed it in its stadiums to track both baseballs and players. [4] Used in conjunction with PitchF/X (which tracks individual pitches) and HitF/X (which tracks batted balls), the Statcast system suddenly made available an entirely new world of data. Now, for the first time, teams could get at the root causes of performance trends, and capture with hard data what the naked eye could only guess at.
![]()
Baseball’s big data revolution is still in its infancy, and with 2015 as the first full season with Statcast in all 30 MLB parks, teams and analysts have barely scratched the surface of what will be possible to learn from the data. [9] Next time you flip to a baseball game on TV, take a moment to think about what’s happening behind the scenes; teams of analysts poring over every pitch and wrinkle of the game, looking for the next edge, the next market inefficiency to exploit. The quality of the game and the competition will only continue to improve as teams and players use data to improve their own skills and identify weaknesses in their opponents, and we can all thank technology and big data for making it happen.
[763 words]
Sources:
- http://www.crawfishboxes.com/2015/4/30/8519577/sabermetrics-10-best-stats-more
- http://www.fangraphs.com/library/
- http://www.baseball-reference.com/play-index/
- http://www.beyondtheboxscore.com/2014/8/21/6051679/statcast-pitchfx-trackman-biofx-saberseminar
- http://www.sloansportsconference.com/mit_news/qa-travis-sawchik-on-big-data-baseball-and-the-rise-of-the-pirates-through-analytics/
- http://www.si.com/mlb/2016/08/26/statcast-era-data-technology-statistics
- http://m.mlb.com/news/article/160896926/statcast-spin-rate-compared-to-velocity/
- http://www.fangraphs.com/zonegrid.aspx?playerid=745&position=DH
- http://fivethirtyeight.com/features/how-baseballs-new-data-is-changing-sabermetrics/
Images
- http://pitchfx.texasleaguers.com/images/understanding-release.gif
- http://www.fangraphs.com/zonegrid.aspx?playerid=745&position=DH&ss=2016-01-01&se=2016-12-01&type=6&hand=all&count=all&blur=1&grid=10&view=bat&pitch=&season=2016
- http://baseball.physics.illinois.edu/images/Tracking-2.png
Teddy – this post has me excited to watch baseball, a rare feat. The story described in Moneyball by Michael Lewis seems fully outdated after learning more about what baseball teams are doing today with PitchF/X, HitF/X etc.
There are two areas I’m curious about…
First, given the incredible about of data teams are collecting, how well do you think they are analyzing and making decisions off this data? Do teams have it all figured out or are there areas of improvement/analysis we are discovering daily?
Second, are you seeing any college or high school teams bring this technology into their strategy? It would be really interesting to watch players grow from high school to professional levels. By tracking which young players were most successful in the MLB, could we begin to predict which high school players have the most potential better?
I’m curious how these stats, while useful for player acquisition and trades, translates into revenue for the clubs and the league. Baseball popularity has decreased over the last few decades, so how is being able to better track players translating into more tickets bought or games watched? Clubs can only afford to have so many good players (and therefore expensive) at one time, so I see how it could help a player negotiate for a better contract, but, as you know, one player does not necessarily make a team good overall so the team still may not be that exciting to watch.
Interesting post! To me, both sabermetrics and Statcast are currently used by MLB teams and players to enhance their performance. But how much of such analysis based on big data is available to baseball fans? If available, how would such data potentially change the way MLB fans watch games in stadium, on TV, or by app? As a baseball fan, I’m interested in how MLB or data analysis companies would encourage fans to consume their data, and make more revenue.
Teddy, how has big data impacted fan experience in the ballpark? Have you seen any on demand applications to live track at games? I understand the overall level of play should be increasing as teams improve their playing ability but wonder how the fans can begin to actually see these changes in real time (augmented reality? better in game heat maps for field position?). Do you have any information on league rules and regulation for data collection and distribution?