
Tableau: Salesforce’s $16 Billion Analytics Enhancement

Breaking down how the near $16 billion acquisition of the data analytics company adds value to Salesforce and its customer through examples and visualizations
Salesforce, the market leader in customer relationship management solutions, acquired the analytics platform Tableau for $15.7 billion dollars earlier this June. Salesforce’s core value proposition is to provide a common platform across divisions of a company to view data about their customers. Its acquisition of Tableau allows Salesforce to become a vertically integrated player across the customer life cycle value chain – from data entry about customers to data integration, and now to data visualization and analytics. This post analyzes how Tableau creates value for Salesforce’s clients by conducting a deep dive into the frictions it helps clients reduce.
Tableau Background
Tableau Software is a business intelligence company with the mission “to help people see and understand data”. The once publicly-traded company enables its users to create complex visualizations and graphics based on big data without any prior programming knowledge. Tableau boasts of a strong customer base across a range of industries including Lufthansa, Dell, and Charles Schwab (https://selecthub.com/big-data-analytics-tools/tableau-big-data-analysis/).
Frictions that Tableau Reduces for Salesforce customers
Connecting to data: Tableau makes it easy for Salesforce clients to connect to data by supporting a wide range of databases and other types of data sources like Excel. The screenshot below shows the exhaustive list of current connections that Tableau supports.

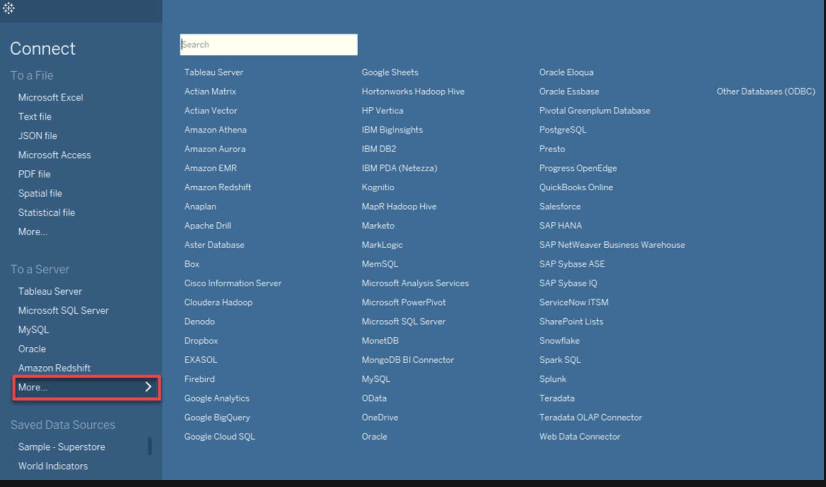
Source: Screenshot from Tableau Desktop
Preprocessing Data: One of the biggest challenges Salesforce clients face in creating great visualizations is the quality of the underlying data itself. A typical data quality problem that one would encounter using a CRM platform is illustrated below. We can see that there are a number of customer orders that have been approved by an employee – C. Arnold. Unfortunately, Arnold’s name hasn’t been uniformly entered on every customer order. Tableau automatically detects and groups all similar instances of C. Arnold under one entry to provide the Salesforce client with an accurate understanding of how many approvals C. Arnold made on customer return orders.
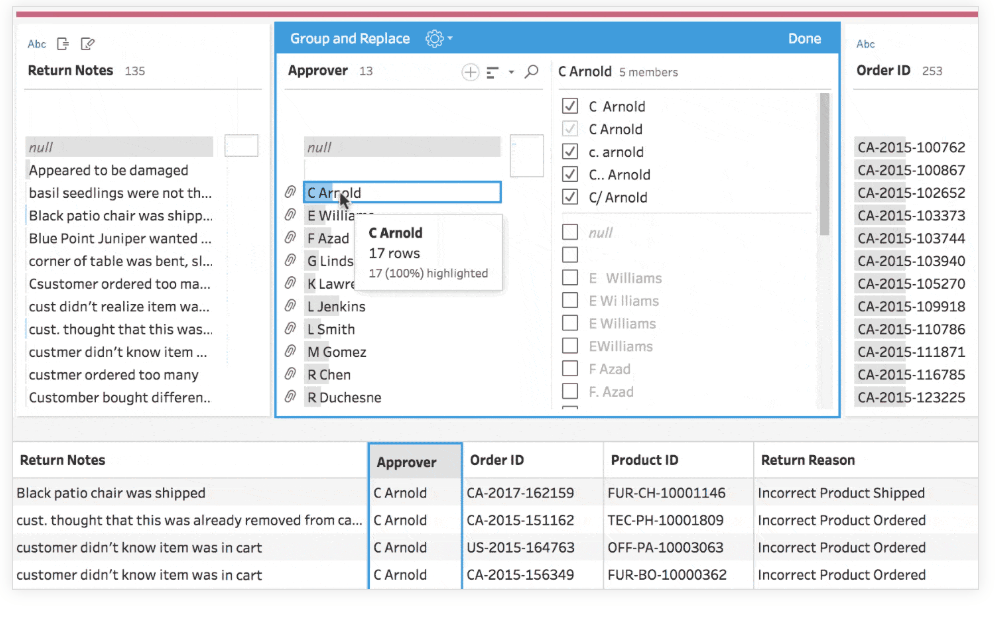 Source: https://www.tableau.com/products/prep
Data Integration
Tableau makes it easy for Salesforce clients to join the many disparate data sources CRM data may live within their organization, including the often-siloed databases that marketing, sales, finance, and operations teams may individually populate. The example below illustrates how data integration is made easy with Tableau. Consider a Salesforce client who is faced with the companies order data being split across an excel sheet and a SQL database. Tableau automatically detects and joins the two sources based on an ID common to both datasets. Tableau also allows the client the opportunity to override or enhance the integration logic through its UI.
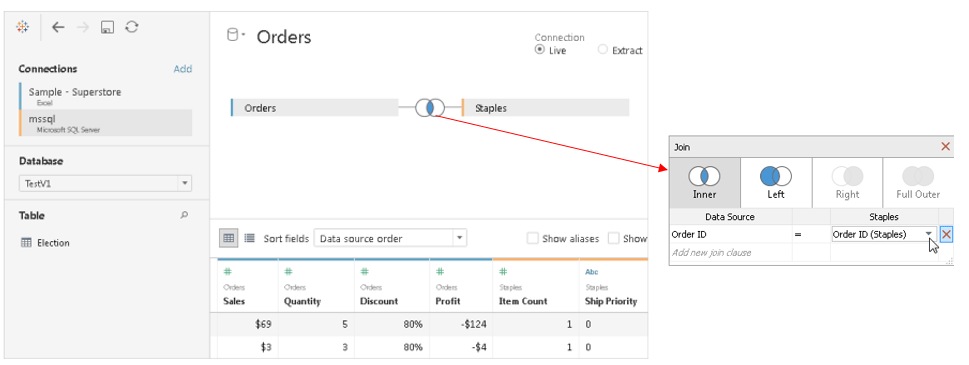
Source: https://help.tableau.com/current/pro/desktop/en-us/joining_tables.htm
Visualizing Data
Tableau empowers its users to make beautiful, rich visualizations without requiring any prior background or experience. Below is a sample visualization made by Boeing, one of Salesforce’s clients, to help visualize the current market outlook for airplanes across regions. The visualization would allow Boeing’s sales team, for instance, to see the distribution of types of planes that are popular across regions to help inform their sales strategy. The dashboard is dynamic allowing the Salesforce client to toggle across regions at the top at which point the graphs will automatically update below. This interactivity allows the salesperson, for instance, to quickly and easily drill down into the areas that are most relevant to her coverage. While the visualizations look very complex Tableau greatly reduces the friction to create them by requiring no coding and providing plenty of templates and documentation. It builds a lot of functionality of dynamic interactions out of the box so that a sales associate can create them for her team by inputting a set of parameters.

Governing Data: Data governance is often a pain point for CRM clients because certain data may be sensitive to teams (i.e. the total sales of an individual employee in a certain coverage region). CRM clients may also include external data from social media, for example, that may come with its own data distribution policy and require proper enforcement from internal compliance and legal teams. Keeping track of who is permissioned for what and at what level can be incredibly time-consuming. Tableau simplifies this process by empowering a single administrator to add and update a user’s permission at the click of a button in a web UI, shown below.
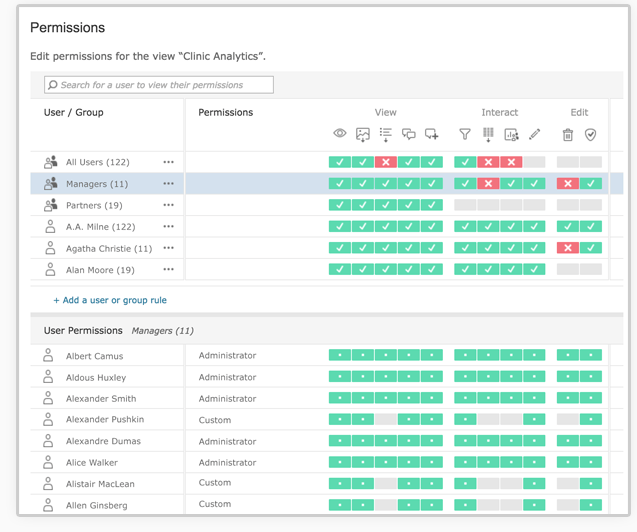
Source: https://help.tableau.com/current/server/en-us/users_site_roles.htm
What’s Next?
Tableau is getting smarter – they’ve invested significantly in artificial intelligence as has Salesforce more broadly with its recent acquisitions of AI startups. One application is to enable users to ask questions about their data and automatically generate answers. The example below shows how Tableau allows CRM clients to type in questions and through its natural language capabilities auto-generate the visualizations. Salesforce clients may be looking at a future where data insights about their customers are generated in real-time conversations.
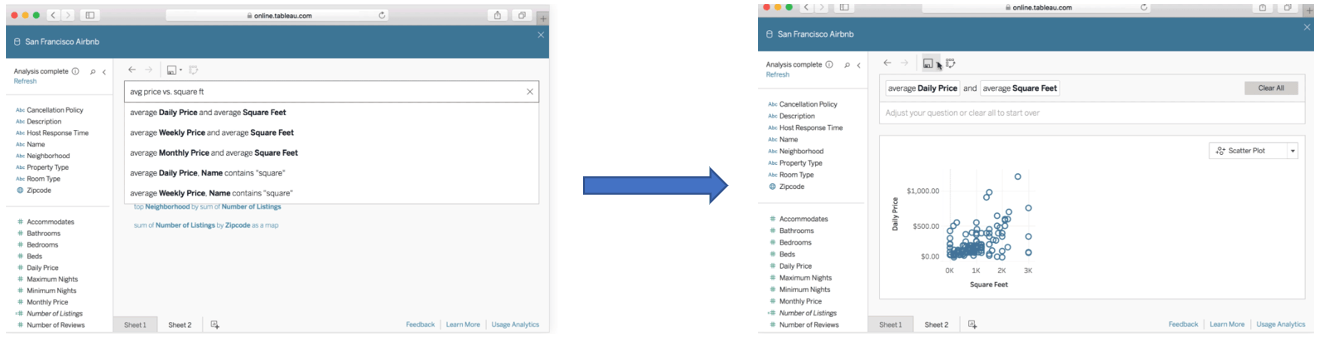
Source: https://www.tableau.com/products/server
Thank you for this post! I am extremely intrigued by Tableau – I have only had limited exposure to it through my past two internships and there was definitely a learning curve, and I oftentimes ended up going back to Excel. The capability of integrating data from multiple sources is so valuable though and I appreciate the governance portion which is super important, even internally.
Amazing post, Sarkis! I was intrigued by Salesforce’s acquisition of Tableau, and your in-depth analysis elucidates the rationale behind this deal.
While Salesforce is benefiting hugely from Tableau’s massive data processing, cleaning and visualization capabilities, how does Tableau use data to better its services and products? For instance, since they have a large customer volume, can they leverage their customer data to improve their dashboard and visualization capabilities? Also, where does data ownership of the other (non-Salesforce) customers lie, and how has that changed with the deal?
Since the success of this deal may inspire other similar vertical integrations by big tech (or other industries) players with their data capabilities suppliers, I am very curious to understand the regulatory and legal repercussions of owning and/or using customer data before the integration?