
Esri and ArcGIS
ABOUT ESRI
Growing out of research conducted at the Harvard Laboratory for Computer Graphics, Environmental Systems Research Institute (Esri from here on) was founded as a land-use consulting firm in 1969 with a mere $1,100 of seed capital from founders Jack Dangermond, graduate of the Harvard Graduate School of Design’s landscape Architecture program, and his wife Laura. Still a privately held company, today ESRI is the world leader in geographic information system (GIS) software, with approximately 43% of the global market share and estimated annual revenues of approximately $1.1 Billion, from roughly 300,000 customers[1].
Established in 1965 by Howard Fisher, the Harvard Laboratory for Computer Graphics helped develop and refine some of the first computer map-making software, becoming a research center for spatial analysis and visualization and the birthplace of many of the early applications of GIS software. Dangermond was a member of the Harvard lab and founded Esri in an effort to apply computer mapping and spatial analysis to help land use planners and land resource managers make decisions informed by data[2]. As Esri’s early work proved the effectiveness of GIS software in problem solving, the company gained recognition, creating a demand for processing an increasing number of projects in an efficient manner. This need combined with increases in computing power, incentivized Esri to develop ARC/INFO—the first commercial GIS product, in 1981. Thus began the evolution of Esri into the software company company it is today.


WHAT IS GIS?
Before getting down to a more in-depth description of how GIS works, here is a description of the software in Esri’s own words,
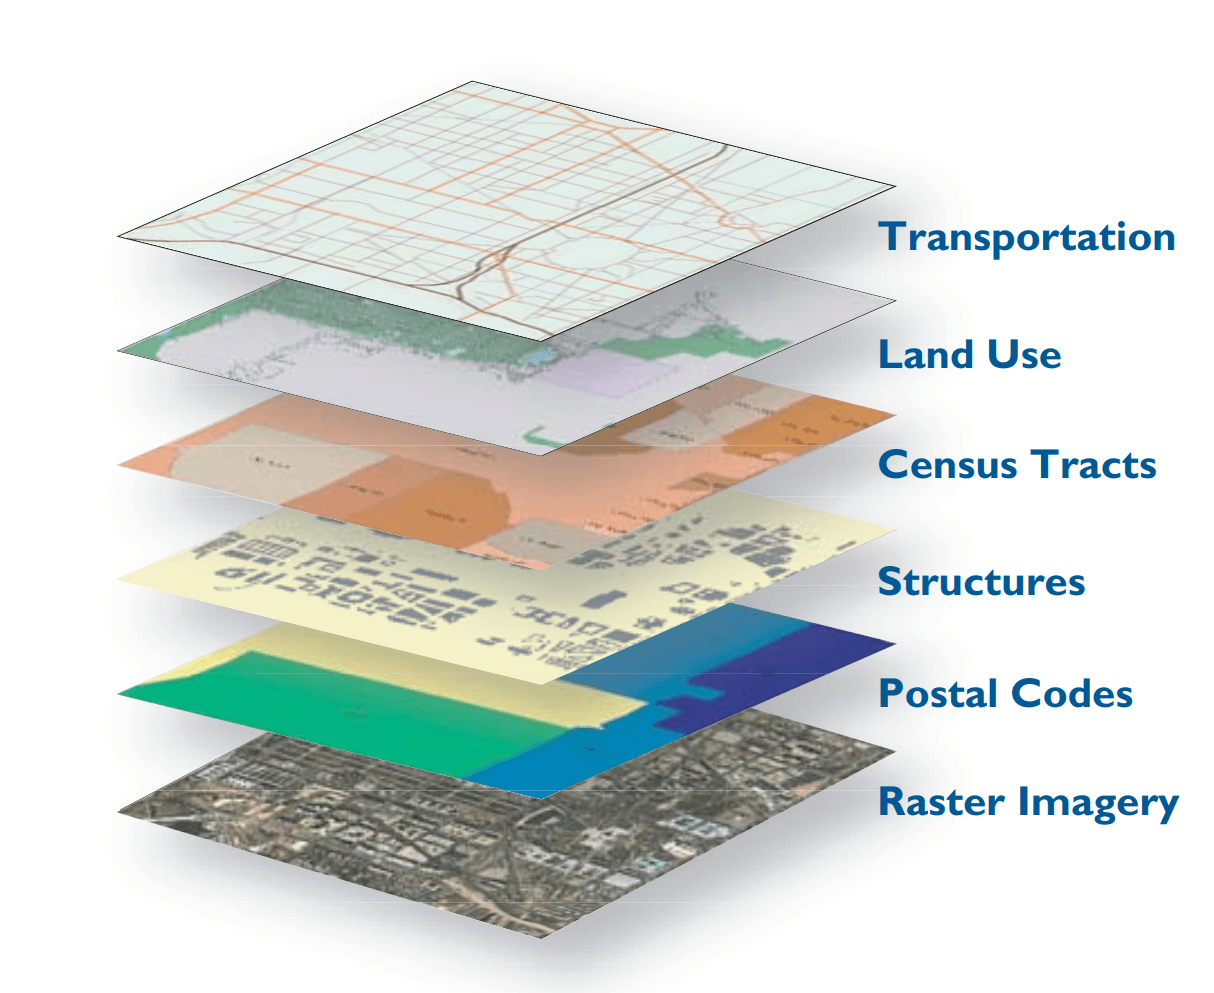
“GIS gives people the ability to create their own digital map layers to help solve real-world problems. GIS has also evolved into a means for data sharing and collaboration, inspiring a vision that is now rapidly becoming a reality—a continuous, overlapping, and interoperable GIS database of the world, about virtually all subjects. Today, hundreds of thousands of organizations are sharing their work and creating billions of maps every day to tell stories and reveal patterns, trends, and relationships about everything “ [3].
A complex software, GIS could be crudely described as layers of spreadsheets containing data that represents real geographic and spatial features, combined with the means of visualizing this data, as well as the means for manipulating the data and creating new relationships and subsets within the data. Esri’s GIS system supports three primary views when working with data: 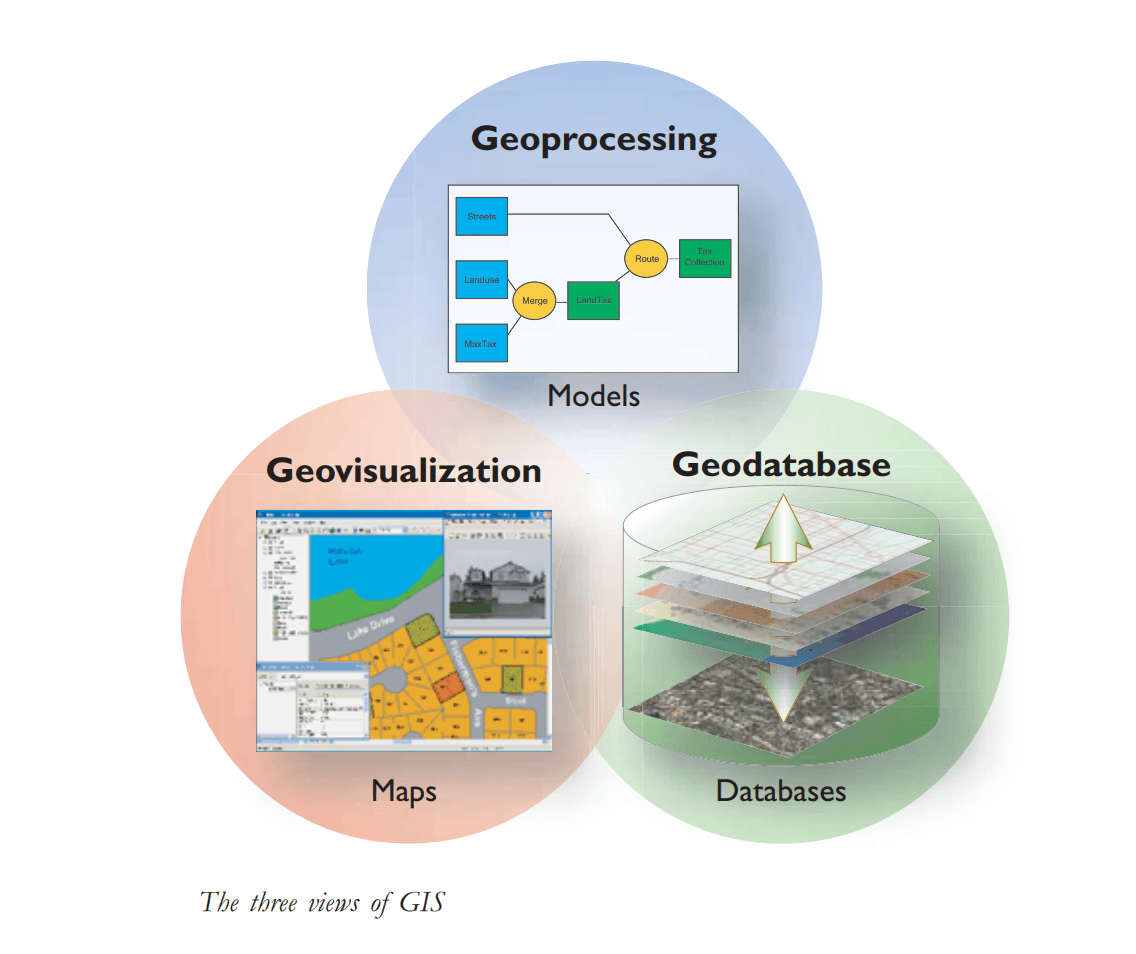
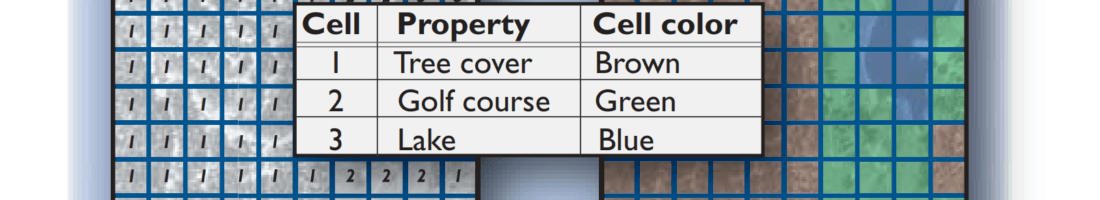
The Geodatabase view: A GIS is a spatial database containing datasets that represent geographic information in terms of a generic GIS data model (features, rasters, topologies, networks and so forth).[4]
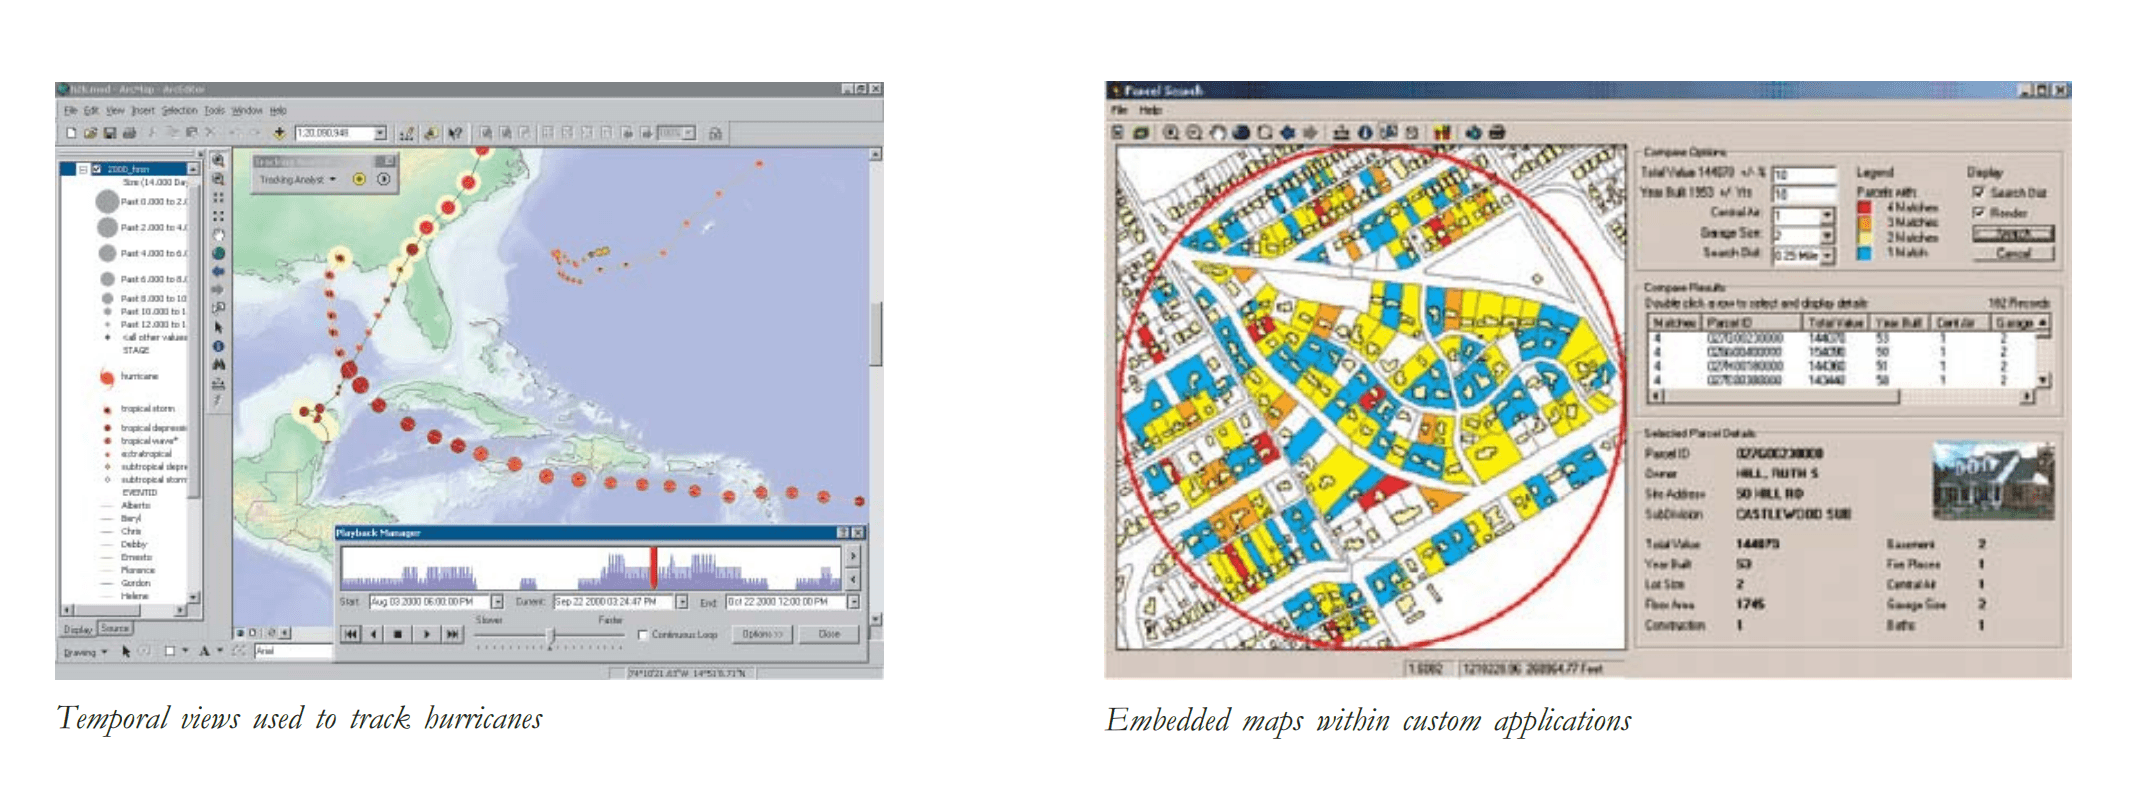
The Geovisualization view: A GIS is a set of intelligent maps and other views that show features and feature relationships of the earth’s surface. Various map views of the underlying geographic information can be constructed and used as “windows into the database” to support queries, analysis, and editing of the information.[5]
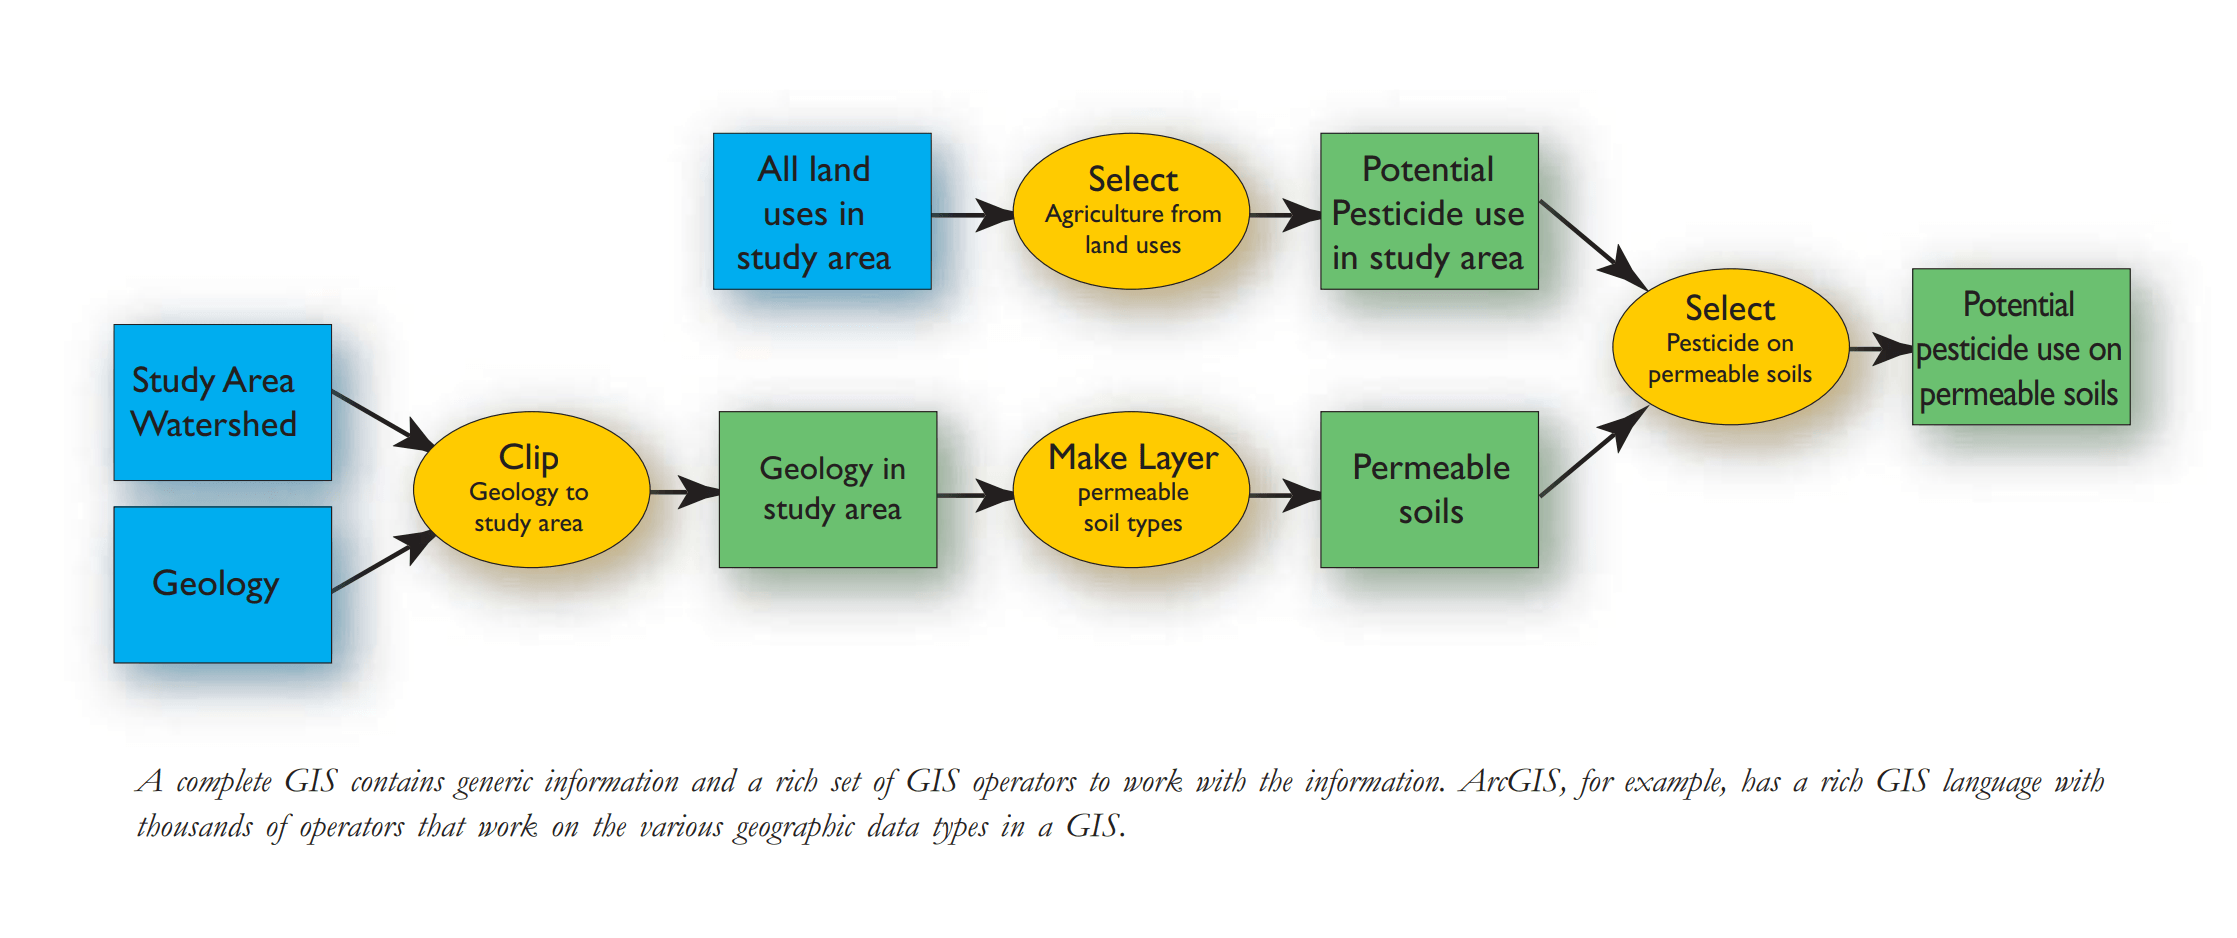
The Geoprocessing view: A GIS is a set of information transformation tools that derive new geographic datasets from existing datasets. These geoprocessing functions take information from existing datasets, apply analytic functions, and write results into new derived datasets.[6]
USE CASES
Esri is currently used by over 350,000 businesses, government agencies and NGOs around the world, collectively creating approximately 150 million maps per day[7]. Some of their high-profile clients include the White House, the Reliance Communications and State government agencies of India and Google[8]. In the words of founder and still current President Jack Dangermond,
Google is the leader in mapping for consumer applications. But when they became interested in creating mapping and GIS software for enterprises, they did venture into our market. If you’re not spending a quarter of a billion dollars like we are on R&D, it’s hard to compete. So they found out it’s more complicated than they thought. So they backed away from it and asked us if we would work with them.[9]
Esri’s ArcGIS software is used in a growing number of contexts and use-cases including but not limited to: mapping, accident analysis, urban planning, transportation planning, environmental impact analysis, disaster management and mitigation, navigation, flood damage estimation and many others. For example, telecom and network service operations must take into account geographic data when designing and optimizing their complex networks and maintenance activities. Additional use-cases of interest include those of a military nature. For example, GIS technology has been used in tandem with shorter infrared wavelengths, where the infrared portion of the light spectrum reflects from foliage, revealing various conditions of plants by color, indicating the state of health of enemy resources[10].

Bibliography
[1] Howell, Donna (2009-08-14). “Jack Dangermond’s Digital Mapping Lays It All Out”. Investor’s Business Daily. Archived from the original on 2010-05-10. Retrieved 2019-11-12.
[2] “History of Esri”. www.esri.com/en-us/what-is-gis/history-of-gis. Accessed 2019-11-12.
[3] Ibid.
[4] “What Is ArcGIS?”. http://downloads.esri.com/support/documentation/ao_/698What_is_ArcGis.pdf. Accessed 2019-11-12.
[5] Ibid.
[6] Ibid.
[7] Hleft, Miguel (2015-3-31). “You Can’t Kill Jack Dangermond’s Company. Try, And It Will Only Get Stronger.” https://www.forbes.com/sites/miguelhelft/2015/03/31/you-cant-kill-jack-dangermonds-company-try-and-it-will-only-get-stronger/#621f78195cd7 Accessed 2019-11-12.
[8] http://www.businessworld.in/article/-Esri-s-Annual-Revenues-Exceed-1-1-Billion-/24-04-2017-116907/
[9] Ibid.
I have used ArcGIS! I used to work for a natural resources company, specifically in their minerals exploration team, where a team of roughly 100 geologists where scouting the world to find copper and nickel mines. They all lived and breathed ArcGIS. “Its a search space reduction exercise” they would say. And ArcGIS was the primary tool they would use to manage such exercise. We had millions of spatial data stored in servers dating from the early 80’s, scattered (physically) throughout Singapore, Australia, London, Tucson and Santiago. The company had generated and acquired through its exploration campaigns loads and loads of geological maps, geochemical samples, geophisycal surveys and drilling results, which the geologists would stack up against each other using ArcGIS to understand where the jackpot may be located. Now they are even leveraging all this data to run machine learning algorithms to help them in their hunt, something that decades ago would have ben just unthinkable. And its working — just before I left the company, we made a discovery in the Oak Dam project in South Australia at the back of our AI prototypes! (think of a section of over 800 meters with 7% copper – yes that’s huge)