
The National Hockey League: 2.5 million shots on goal and counting (and analyzing)

The National Hockey League partners with SAP to provide fans with enhanced statistics that have increased site traffic and fan engagement.
Founded in 1917, the National Hockey League (NHL) presently consists of 30 teams across the United States and Canada. The league’s players hail from over 20 countries and its fans from even more. The fast paced game and lack of numerous “counting stats” (e.g. Runs Batted In (RBI) in baseball, Receiving Yards in football), has limited the NHL’s fan base relative to its peer professional sports leagues in North America. Further, two league-driven lockouts in the past ten years eroded the already diminished fan base. Recent rule changes that emphasized skating, reduced fighting, and increased scoring have helped restore interest in the sport, but the NHL has continued to look for ways to attract new fans and increase engagement with existing fans.
In February of 2015, the NHL and SAP announced a partnership to transform the league’s statistics platform and introduce new and enhanced statistics (nhl.com/stats). Fans can now easily and quickly analyze their favorite team or player and compare statistics across the league and across history. In announcing the partnership, John Collins, COO of the NHL, said, “Hockey is extremely fast-paced with very little stoppage in play, which results in many aspects of the game failing to show up in the box score…In partnering with SAP and using its best-in-class SAP HANA Enterprise Cloud service, we are now able to capture date points like never before and present existing and new statistics in a visually appealing way.”

Value Creation: Historically the NHL recorded game statistics—limited to goals, assists, points, shots on goals, and penalty minutes—with pen and paper.


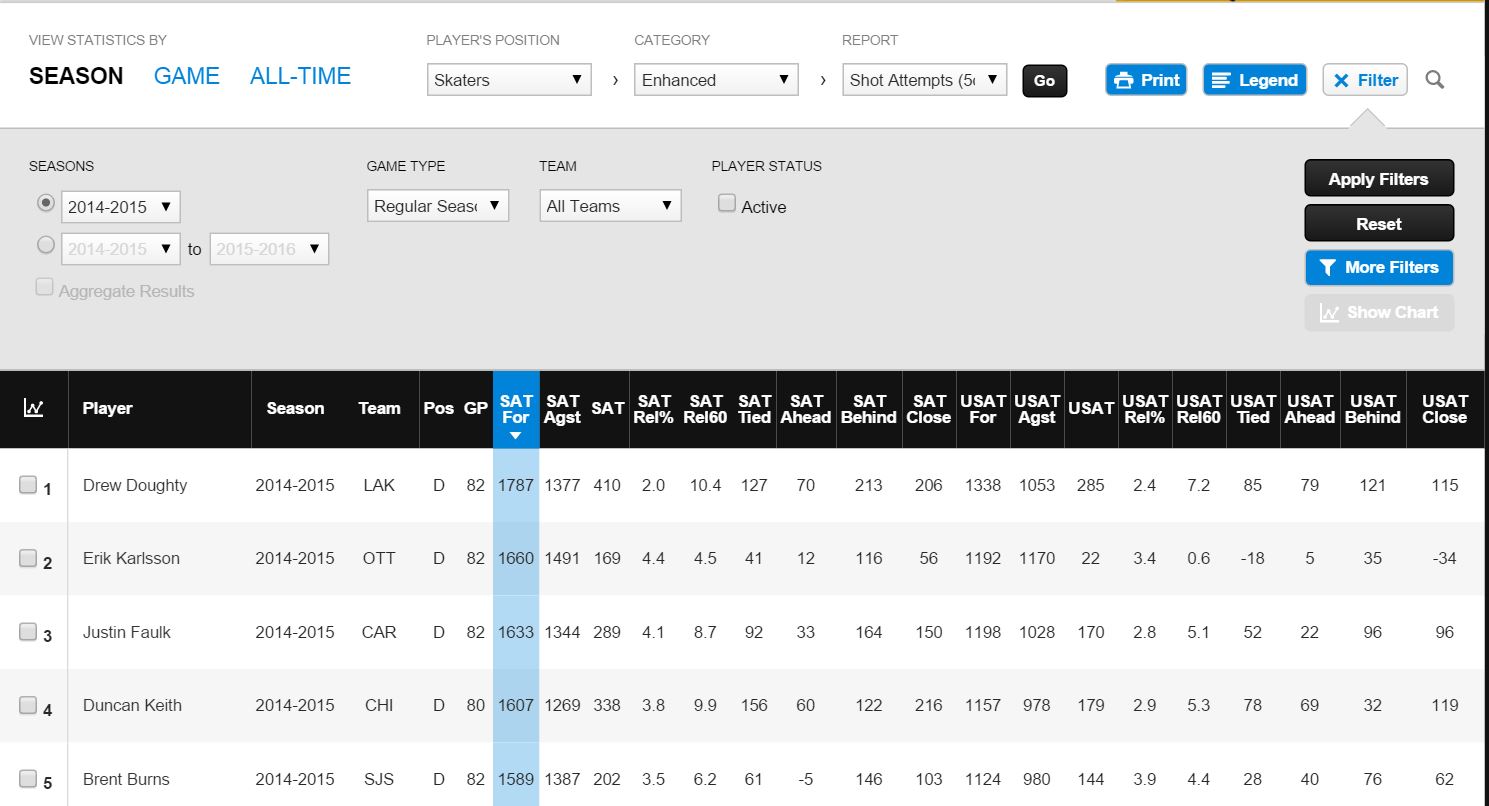
The partnership with SAP took 97 seasons, 7,250 players, 50,000 regular season games, 310,000 goals, and 2,500,000 shots on goal and provided new “enhanced” statistics, including the popular Corsi and “Puck Luck.”
Corsi – measures Shot Attempts For, which equals Team Shots on Goal + Team Missed Shots + Opponent Blocked Shots excluding empty net). Corsi quantifies “puck possession,” and is correlated with wins. Corsi can be applied to teams and individual players.
Puck Luck – combines on-ice shooting percentage and on-ice save percentage (SPSV%) and measures how lucky or unlucky a team/player is. An average puck luck score is 1000, with a higher number representing the presence of luck. An analysis of the data has proven that teams and players above 1000 will regress to the means, and team/players below 1000 should see an improvement in time.
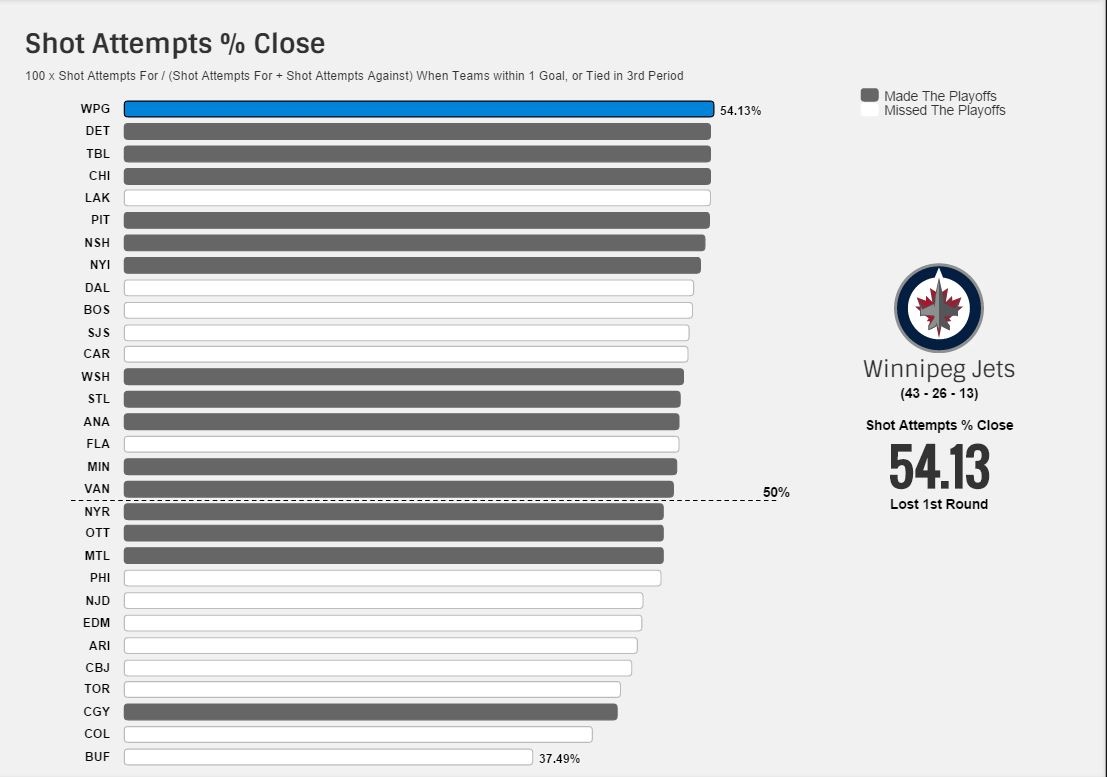
Further analysis discovered that “Shot Attempts % Close” (100 x Shot Attempts For / (Shot Attempts For + Shot Attempts Against) when teams are within 1 goal or tied in the 3rd period) is “a significant indicator of which teams make the Stanley Cup Playoffs.”
In time for the upcoming playoffs, the NHL and SAP will roll out Phase 2 of the project, which “will feature analysis for every Stanley Cup Playoffs game and series. Based on a team’s recent performance, each series will be examined based on an algorithm that incorporates 37 variables – such as road record, goals against, special teams statistics, and many more.”
In summary, “The new NHL stats platform goes beyond data to offer insights that will help avid fans go deeper and help casual fans understand the game better. There are also unlimited storytelling opportunities we provide our fans with a personalized and interactive experience,” explained Collins.
Value Capture: while the enhanced statistics are available for free and therefore do not directly result in the NHL capturing value, since the partnership with SAP there has been a 25% increase in new visitors to the site and a 45% increased time and engagement on site. These engagement numbers help sell advertising, and potentially direct fans to play fantasy hockey on the site (which relies on stats). Further, the NHL hopes the digestibility of the enhanced stats will encourage fans to become more engaged and therefore buy merchandise and attend games in person.
It is interesting to see how the SAP Hana platform keeps being integrated into sports teams. This post definitely reminded me of the TSG Hoffenheim case, in which SAP Hana was used to manage players and engage fans. It appears SAP also is the partner of choice for the NBA and the German Football Association. Clearly these sports teams see the value in data and analytics, and the potential competitive edge that comes with having access to such data. In this post’s case, I see that SAP has lead to more engagement, but I’d be curious how this engagement actually translates into monetization. Does this investment pay for itself?
Thank you for posting about hockey! It is good to see the NHL-SAP partnership; hopefully this will generate more interested in hockey in the States by attracting the data-focused, Moneyball crowd to the sport. During the TSG Hoffenheim case, we discussed whether soccer teams could use data analytics like Billy Beane did in Oakland with baseball; the majority of us believed soccer teams could, although the data are less straightforward than in baseball. Since hockey is similar to soccer, I think that hockey teams should also use data analytics. This partnership will make doing so easier, and perhaps we will see more models of how to value players, like the one here: https://github.com/auerifher1Ew/iceHockey_2015_summer/blob/master/evaluateNHL.pdf.
A baseline of sports data has made new industries like fantasy sports possible. Could fantasy leagues get more popular for sports other than football as data for those sports becomes more pervasive and is better collected? I wonder if that will become the expectation for all sports…