Tableau Software – Unlocking Insights in Data

In a world with no shortage of data, Tableau Software offers an incredible product to quickly analyze large data sets and rapidly produce high-quality visualizations.
In the year 2020, IDC estimates that the world will generate 50x as much data as it did in 2011, from 75x the number of information sources. In this ever rising tide of data, many new tools have been introduced to help analyze and interpret our information at increasingly rapid speeds. One software firm stands out as a leader in this space, offering tools to generate and monitor insights in data that fits the needs of high-performance data scientists, managers of large enterprises, as well as individuals and hobbyists, that firm is Tableau Software.
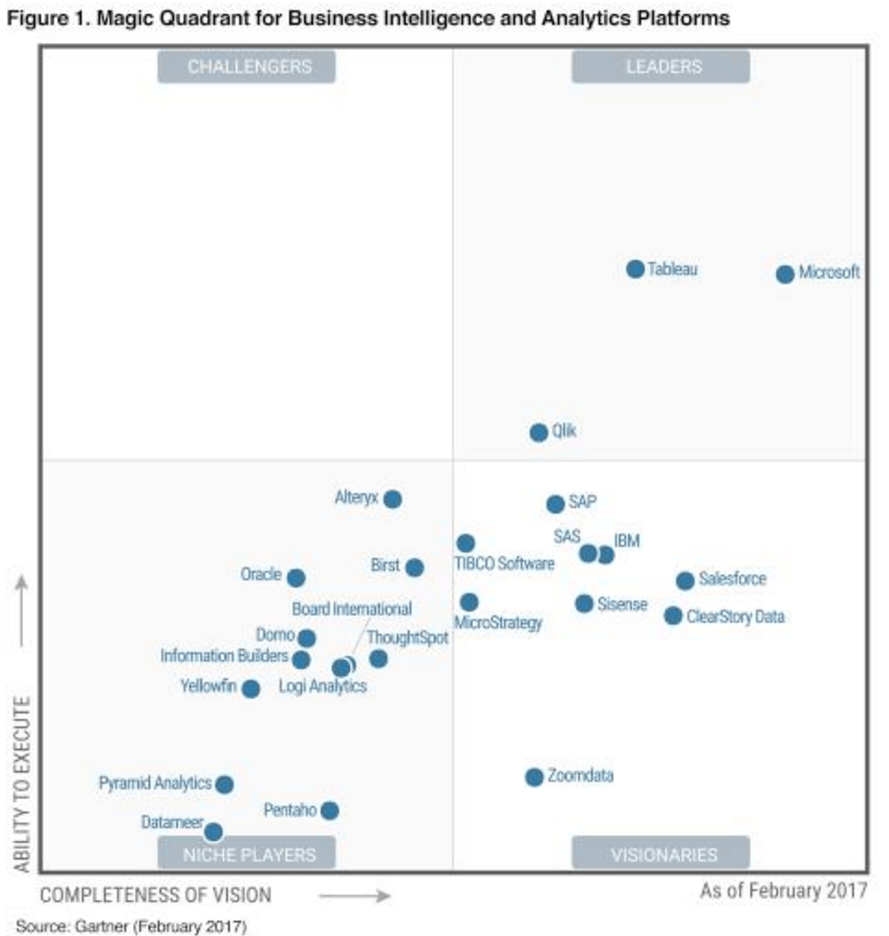
Tableau is a data visualization company that can plug directly into a wide variety of data sources (AWS, Excel, Google Cloud, Hadoop, SAP, SQL Server, Salesforce, and Splunk, to name a few) and rapidly interpret a data set and convert it into Tableau’s easy to use data visualization software. After linking to a data source, a user on Tableau can play around with various columns of information to quickly and easily build a wide variety of fantastic looking charts to search for data insights. Tableau makes it very easy to manipulate the data to view it in many ways, very quickly. For example, if you have built a chart in Tableau showing quarterly sales for a period of 10 years, and you want to drill down to see the same chart for just two years, you can do so nearly instantly with the use of a filter. Tableau has both a desktop and server application so that a person can upload visualizations into the Tableau server and have them accessible to anyone else on the server around the world, both on desktop and mobile. Few companies offer the same ability to grab data so quickly for analysis and provide the same high-quality visualizations that are fitting for top quality C-Suite and client presentations. Gartner consistently recognizes Tableau as a leader in Business Intelligence and Analytics:
This service is by no means cheap: Tableau prices its product per user at $999 – $1,999 for the desktop version (with a lower annual maintenance fee), and the server starts at $10,000 (for 10 users) and $2,500 / year after that. Don’t worry though! Students (including HBS) can get a license for $free.99. Despite the steep price, the results are well worth it. You can click here to see a list of Tableau’s 50,000+ customers, which includes many of the world’s largest companies across a wide variety of industries.
In addition to offering a data visualization service for companies and organizations to use to unlock data insights, Tableau has built an online community of data enthusiasts and bloggers who publish Tableau-created charts utilizing data that they find interesting. This community helps to create and publicly share innovative ways to visualize data, as well as to market to individual users the power of the Tableau product. This is called Tableau Public, and some of the coolest visualizations I’ve seen on here include:
- Adult BMI tracking over 40 years in 200 countries
- A History of NASA Space Flight by mission, the number of flights, and the distance traveled
- The History of the Home Run Record in the MLB
While building a fantastic product, Tableau has certainly faced challenges. In February 2016, after reporting quarterly earnings Tableau’s stock price fell by 50% and has only marginally recovered since. Though some could cite that all software companies traded down in public markets around this time, more thoughtful arguments highlight the fact that Tableau’s success has encouraged competition in the data analysis and business intelligence space, with many offering a product that is much cheaper than Tableau’s offering. In August 2016, Tableau’s co-founders stepped down from their management positions (CEO and Chief Development Officer) to bring in new leadership. In order for Tableau to stay ahead in data analysis and visualization, the Company will need to both compete on price vs. competition and also continue to develop new and innovative ways to analyze and manage vast quantities of data. In Tableau now, the user builds many of the visualizations from the start. But just as Tableau has automated importing and sorting data to be ready for easy analysis, one could see a future in which software companies build automation
In order for Tableau to stay ahead in data analysis and visualization, the Company will need to both compete on price vs. competition and also continue to develop new and innovative ways to analyze and manage vast quantities of data. In Tableau today, the user builds many of the visualizations from the beginning. But just as Tableau has automated importing and sorting data to be ready for easy analysis, one could see a future in which software companies build automation for data analysis in which the software identifies correlations and relationships within data sets, and then chooses the appropriate visualization for the identified data relationship automatically. That type of automation could definitely command premium pricing in today’s market.


